JavaScript Debugging for Beginners
Note: the interactive parts of this post do not work any more after years of migrating to different static site generators and much of the code being out-of-date.
I set out to write a post about JavaScript debugging for beginners because I often see people struggling with this and want to help. I hope this post provides some useful information to help you get started. I tried to cram a lot in here, so it is just a start. I hope to write some follow-up posts in the future that dig into more detail.
Let's start with some assumptions for this post before we get started:
- This is for browser-based JavaScript debugging. If you're looking for help with node.js, you're in the wrong place.
- This post assumes you are at least a little familiar with writing JavaScript in the browser. You don't need to be an expert, but I won't be explaining js basics here.
- This post assumes you have a basic grasp of what debugging is as a programming concept.
- You'll get the most of this post by being hands on. Try clicking the buttons. Try inspecting things. Try copying and pasting code to see how it works.
- I make some cheesy Dune references in this post. I regret nothing.
Note: This is a pretty interactive post. You may find it useful to open it in two tabs. One for you to reference the writing and one for you to play around with.
Disclaimer: The JavaScript I wrote for this post is pretty quick and dirty. It is not an example of good coding practices. The point of this post is to teach you how to debug js, not how to write good js. Perhaps that is a post for another day.
Table of Contents
- Alert
- Developer Tools
- Console
- console.log
- Interactive Debugger
- Libraries and Minified Code
- AJAX Requests
- Performance
- Mobile
Alert
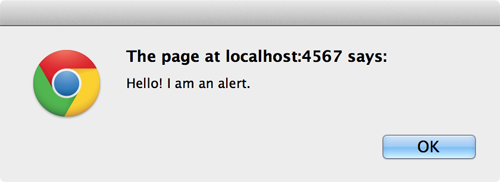
The alert displays a dialog with the specified string value and an "ok" button to dismiss it. It will stop the JavaScript from continuing until you click "ok".
alert("Hello! I am an alert.");
This is useful for debugging because you can set the alert value to something meaningful.
// I want to know if I reach this part of the code.
alert("I am here!");
// I want to know the value of foo in this part of the code.
alert("Foo: " + foo);
If you accidentally put an alert in a place that runs a lot of times, it can get annoying really fast. In the past, I occasionally had to kill a browser and restart it.
// I heard you like alerts...
for (i = 0; i < 100; i++) {
  alert(i);
}
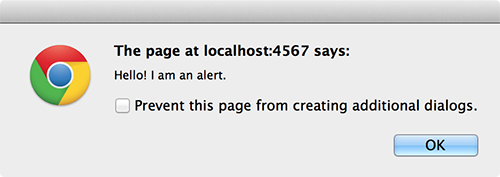
Thankfully, we are no longer in the past. Chrome will help you out if you accidentally make too many alerts. Clicking the "Prevent this page from creating additional dialogs" checkbox in the alert will do exactly what it says.
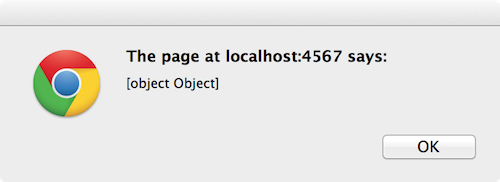
Way back in the day, alerts were one of the main tools people used to debug their JavaScript. Unfortunately, the alert is a very limited tool. It can only display strings.
// I want to see all the H2s on the page.
alert($("h2"));
Well, that's pretty useless.
Why am I mentioning alerts if they're limited and painful to use? Because occasionally you still need to fall back on this old tool.
Even when better debugging tools became available, there were still occasions where I had to debug my JavaScript using alerts (insert angry rant about IE6). Be thankful that we are mostly beyond that time. I have recently used alerts for debugging on a mobile device where I was not able to get the debugging tools to work.
Developer Tools
Welcome to the future! Well, sort of. Developer tools have been around for years. However, they've grown and added a ton of useful new features that many people are unaware of or don't know how to use. Developer tools are invaluable for JavaScript debugging. I'll spend the rest of this post talking about how to use them.
For the duration of this post, I will be giving advice about using the Chrome developer tools. They have been my developer tools of choice for several years now. If Chrome isn't for you, many other modern browsers have similar tools, so a decent amount of this post should still be useful.
Before you can use the Chrome developer tools, you have to know how to access it. You can open it in a few different ways.
You can open it via keyboard shortcuts:
- Windows/Linux:
ctrl+shift+I - OSX:
cmd+opt+I
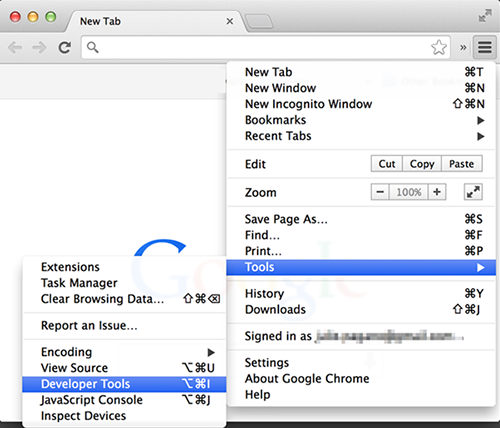
You can open it from the chrome menu.
You can open it by right-clicking the page and inspecting an element.
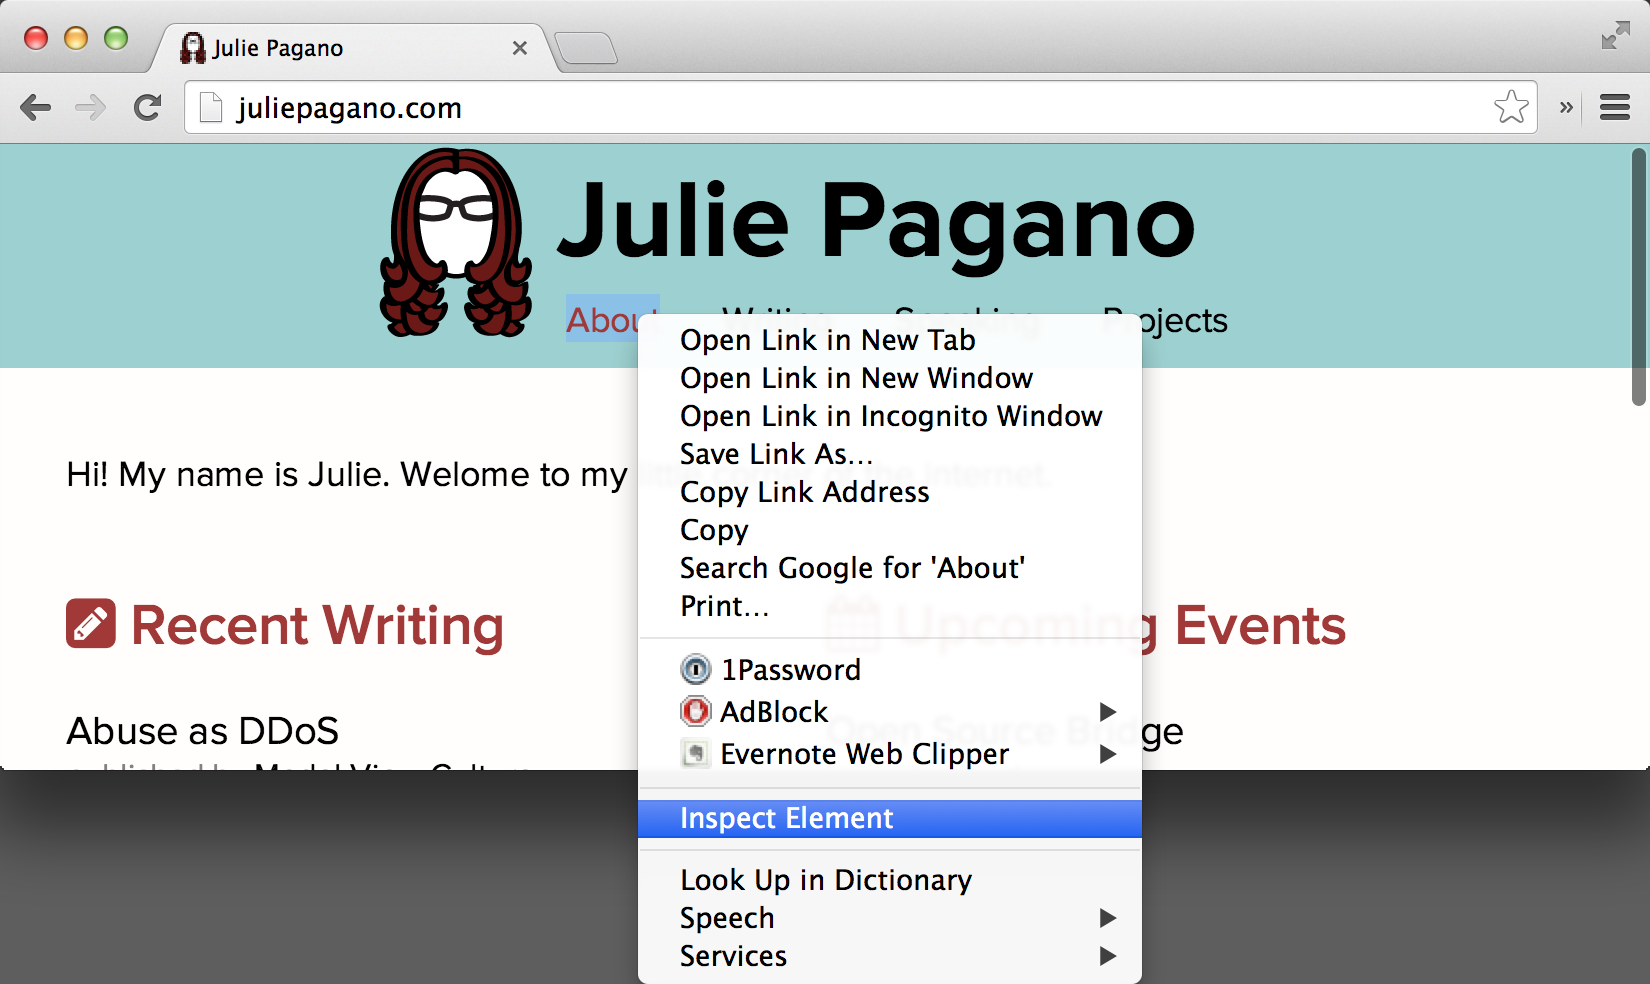
It looks something like this. We're going to start on the "Console" tab, so click that tab if you're not already there.
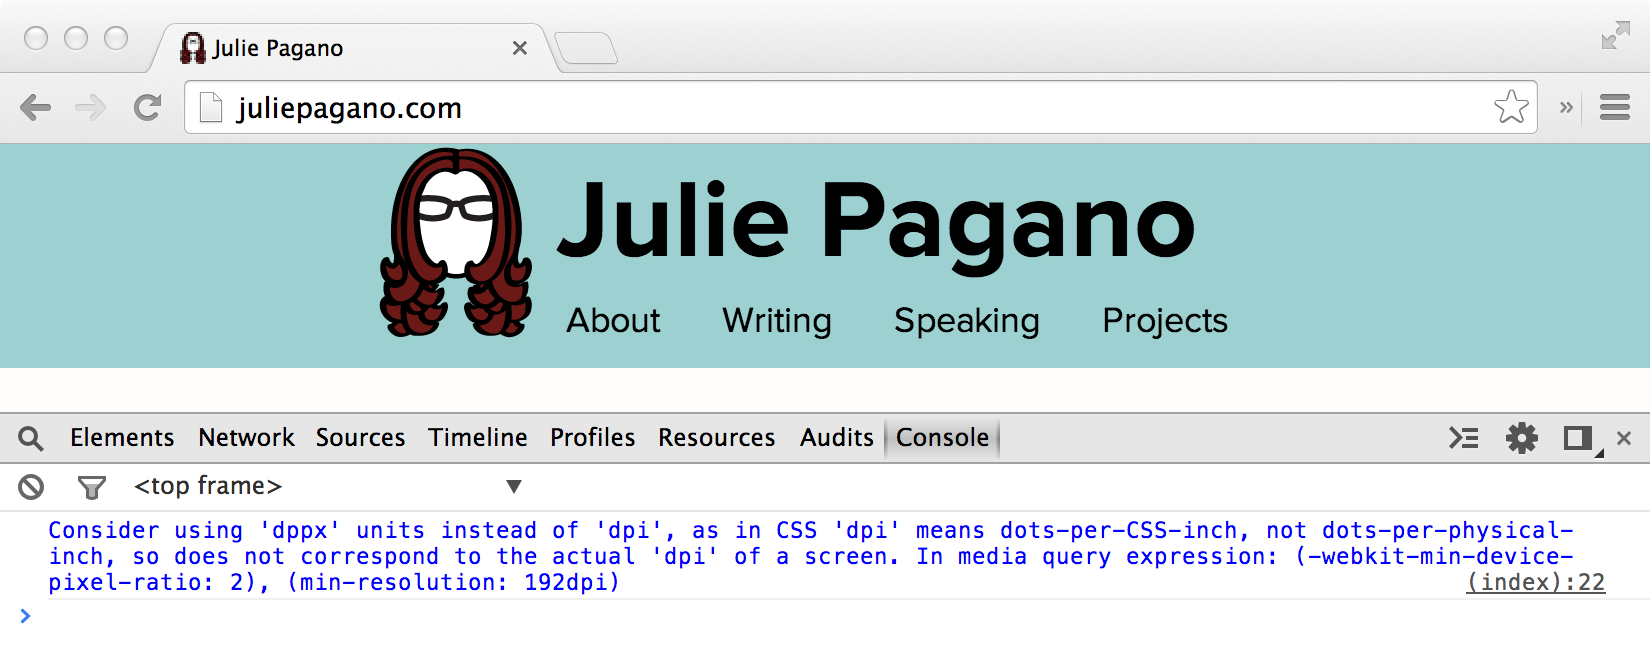
Console
The console is an incredibly useful part of JavaScript development. In many programming languages, you do debugging and logging in the terminal. The console is the equivalent for JavaScript in the browser.
Errors
The console tab shows JavaScript errors.
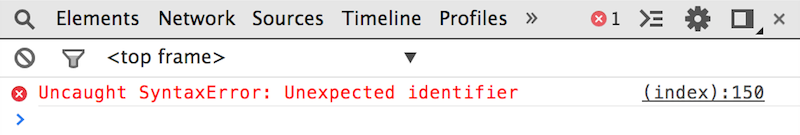
It also shows you where the error originated. Click the underlined file name and line count to the right of the error to be taken to the origin.
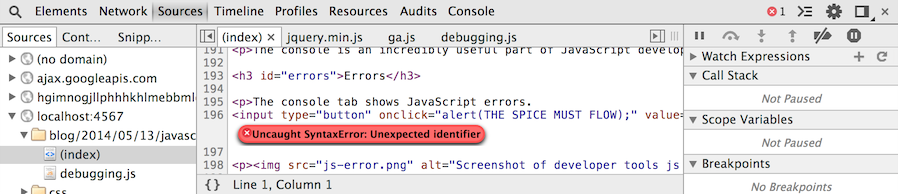
<input
  type="button"
  onClick="alert(THE SPICE MUST FLOW);"
  value="Click to create an error"
/>
This line seems to be the problem. Can you figure out what's wrong? How should we fix it?
Command Line
The console has an interactive command line that can be useful for debugging. Below are some examples. Give these a try in your console.
You can do some basic JavaScript.
// Try some math.
2 + 2;
// How about some string manipulation
"the golden " + "path";
// You can even create an alert
alert("Muad'Dib!");
And some more complicated JavaScript.
// You can create variables.
var arr = [1, 2, 3];
// You can add multiple lines by pressing shift + enter.
for (var i = 0; i < arr.length; i++) {
  arr[i] = arr[i] * 2;
}
arr;
The console provides a bunch of helper functions. See the command line api reference for more information.
// You can look up elements via css selectors
$$("h2");
// Or xpath
$x("//h2");
You can access libraries defined on the page. For example, this page has jQuery.
// You can make the page red.
$("body").css("background-color", "red");
// That's a bit much. Let's put it back.
$("body").css("background-color", "");
You can access variables in the current context. We'll talk about this more later.
// The current context.
this;
// Access a variable I set in this context.
exampleVariable.join(" ");
console.log
The console.log method outputs a message in the console.
console.log("I am logging to the console.");
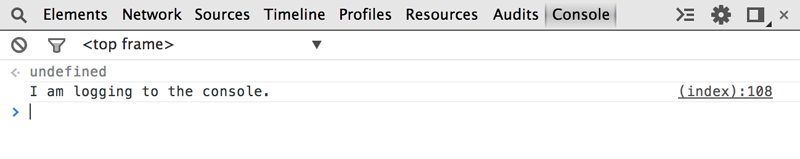
This is basically the JavaScript equivalent of using a print method for debugging. Just like an alert, we can use it to output values or check that we reach certain places in the code.
// I want to know if I reach this part of the code.
console.log("I am here!");
// I want to know the value of foo in this part of the code.
console.log("Foo: " + foo);
Unlike an alert, console.log does not stop the JavaScript from continuing. It logs to the console and continues on its merry way.
// This isn't nearly so annoying with console.log.
for (i = 0; i < 100; i++) {
  console.log(i);
}
Alerts could only output strings, which limited the information they could provide. Console.log has no such limitation.
// It can output dom elements.
console.log($("h2"));
// It can output objects.
console.log({
  book: "Dune",
  characters: ["Paul", "Leto", "Jessica", "Chani", "sandworms"],
});
This is just the beginning. There is a lot more you can do. I recommend reviewing the console api reference for more information.
The console logging provides enough for you to get by, and some developers stop there with their JavaScript debugging skills. However, it's not always the best tool for the job. Debugging complex JavaScript using console logging can be slow and painful. Thankfully, there are even more debugging tools available to you.
Interactive Debugger
The Chrome Developer tools has an interactive JavaScript debugger that provides a rich toolset useful for debugging your code. I find this especially useful for complex JavaScript code and code that interacts with other libraries.
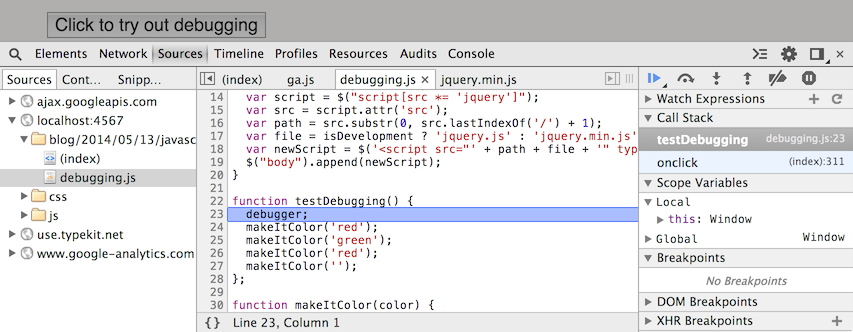
You can start the debugger at a specific point in your code by calling debugger.
// I want to start debugging here.
debugger;
The debugger will only do something when the developer tools are open. Close the developer tools and click the button. Hmm, it looks like nothing happened. Now try opening the developer tools and clicking it.
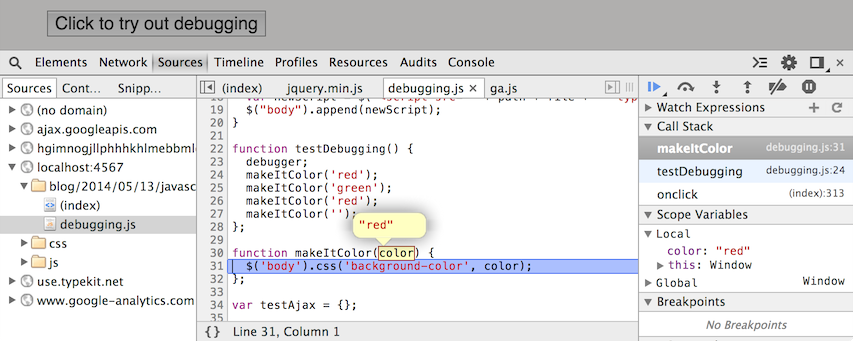
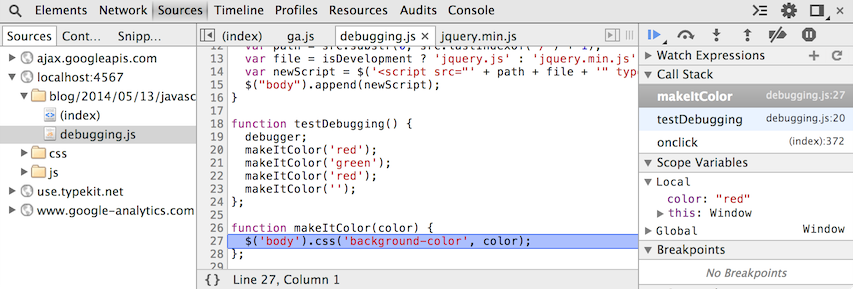
You should see something like this. Now you can start debugging!
If you click the "continue" button  , it will continue running the code until it hits another breakpoint. Again, doesn't seem like much happens. Let's try something else.
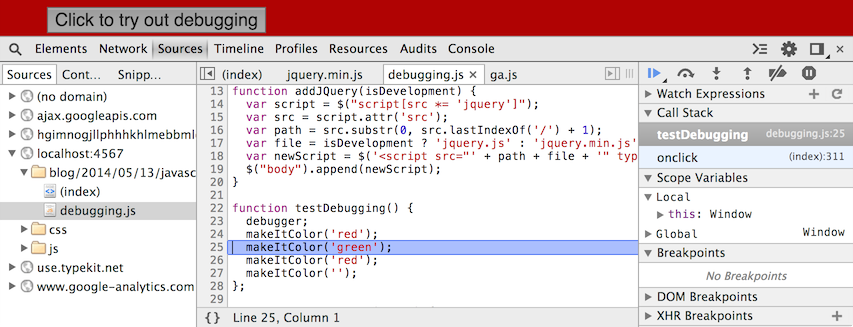
If you click the "step over" button  , it will step over the next line of code. Do this a few times.
It turns out this code does do something. It just happens so fast, we couldn't see it before.
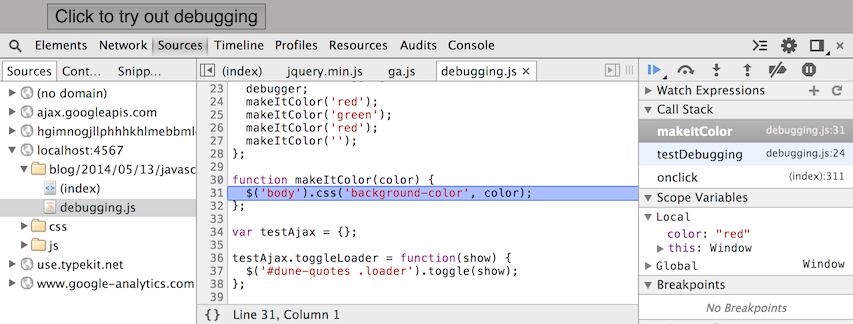
What if you're interested in finding out what the makeItColor function does. Step over until a call to that function is highlighted. Then click the "step into" button  to step into that call. You can click the "step out" button
  to step out of the call.
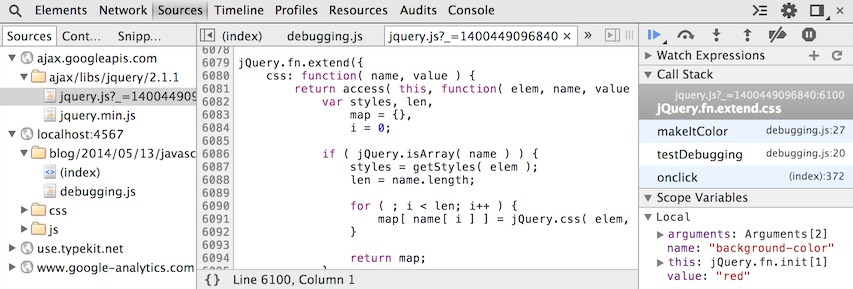
The panel on the right includes useful information about your current location in the code.
You can find out the values of code in the debugger by highlighting it and hovering over it.
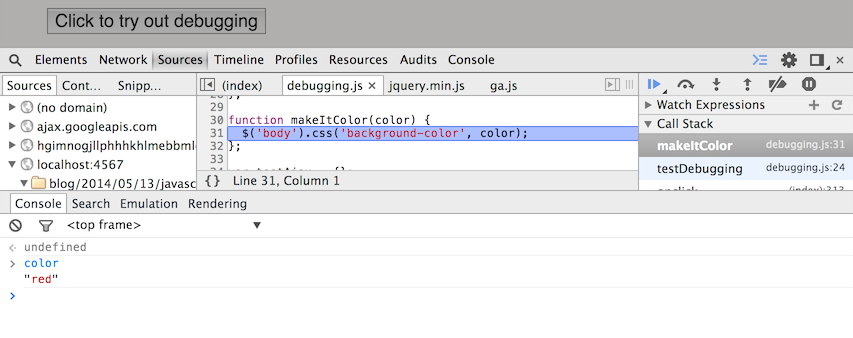
You can open up a console on the sources tab by hitting esc. This can be useful for playing around a with the variables and other information in that context. You can dismiss the console by hitting esc again.
You can manually add breakpoints by clicking the line number of code where you want to stop.
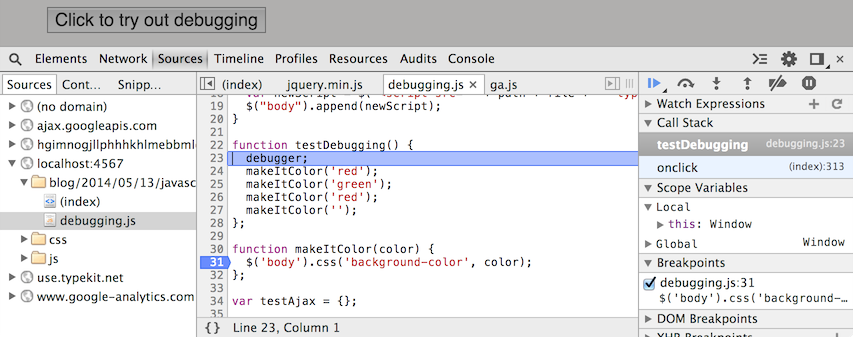
Now the code will break on this line. You can hit continue a few times to go through all of the color changes to the page background. You can remove a breakpoint by clicking the line number again.
I'm not going to go into much more detail about using interactive debugger. The debugging javascript documentation already does a great job of this, so it seems silly for me to duplicate it.
Libraries and Minified Code
Sometimes, your debugging needs to dig into interactions with other libraries you depend on.
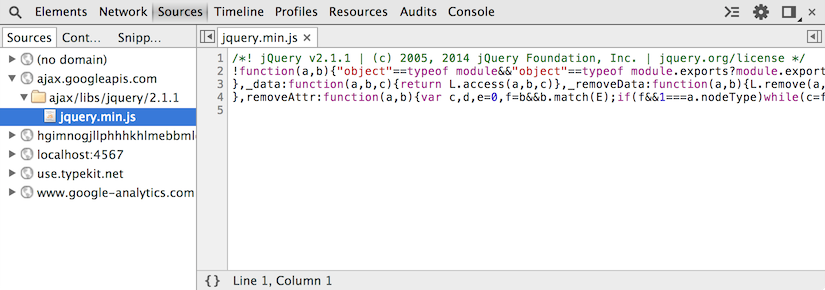
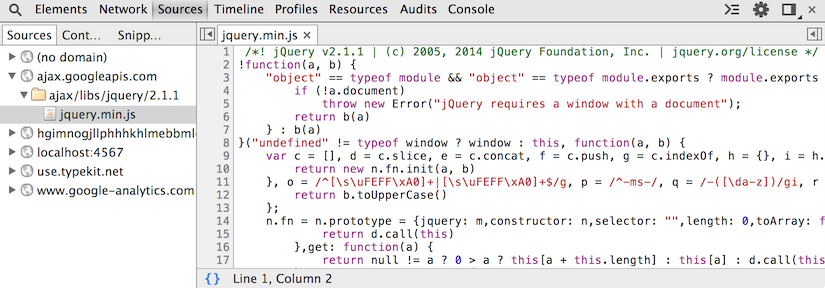
On this page, I'm using the jQuery library, so we'll use that as an example. Open the developer tools. Go to the sources tab. Find the jQuery library, and click on it to take a look.
Well, this is pretty impossible to read. This code is minified.
If you click the braces at the bottom of the developer tools, they will "pretty print" the code. It makes it a little bit more readable, but it's still difficult to decipher.
Minified code is useful for production, but very difficult to deal with when debugging in development. Thankfully, many libraries will let you use an unminified development version of the code. You can switch to this during development to make it easier to debug problems. Be sure to switch back to the minified code before you go to production.
<!-- For production -->
<script
  src="//ajax.googleapis.com/ajax/libs/jquery/2.1.1/jquery.min.js"
  type="text/javascript"
></script>
<!-- For development -->
<script
  src="//ajax.googleapis.com/ajax/libs/jquery/2.1.1/jquery.js"
  type="text/javascript"
></script>
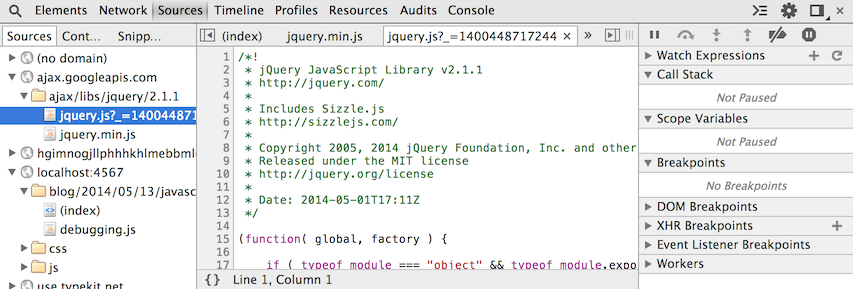
Click this button to switch the page to using development jQuery.
Go to the sources tab. Find the new jQuery library, and click on it to take a look.
Look! We've got meaningful variable names and commented code! Much better for debugging.
Let's try it out!
Go to the line in makeItColor where we are using jQuery functions.
Step into the code. This is stepping into $('body') to find and return the body element.
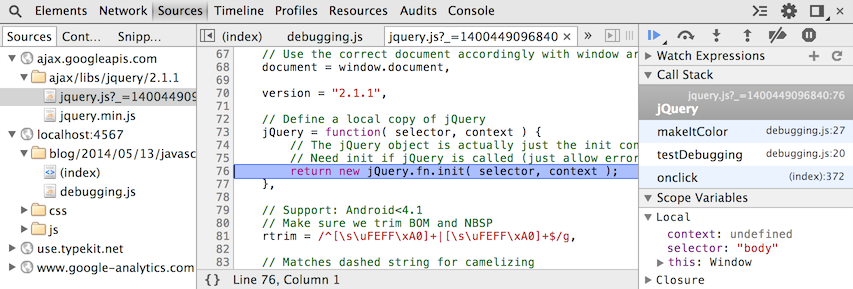
Step out and then step into again. This is stepping into .css('background-color', 'color') to set the background color of the element via css.
Hopefully, you won't have to debug the libraries you work with very often. However, it's useful to understand how to do so when things behave unexpectedly. Sometimes you'll even find a bug in the library you are using.
AJAX Requests
The network tab of the developer tools is really helpful for testing issues related to ajax requests.
Let's take a look at an example viewing a twitter timeline.
- Go to @horse_js (or some other twitter user you like better).
- Open the Chrome developer tools.
- Go to the network tab.
- Click on the filter icon
 .
. - Click the XHR filter option (it stands for XMLHttpRequest) - that will limit us to the ajax request we're looking for.
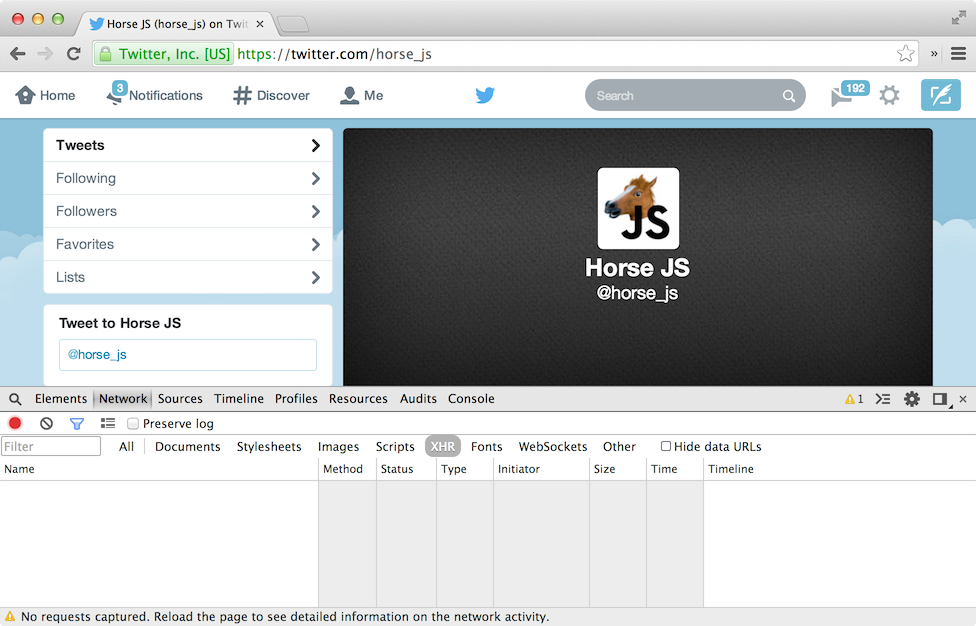
- Scroll down the page to trigger an ajax request for more tweets.
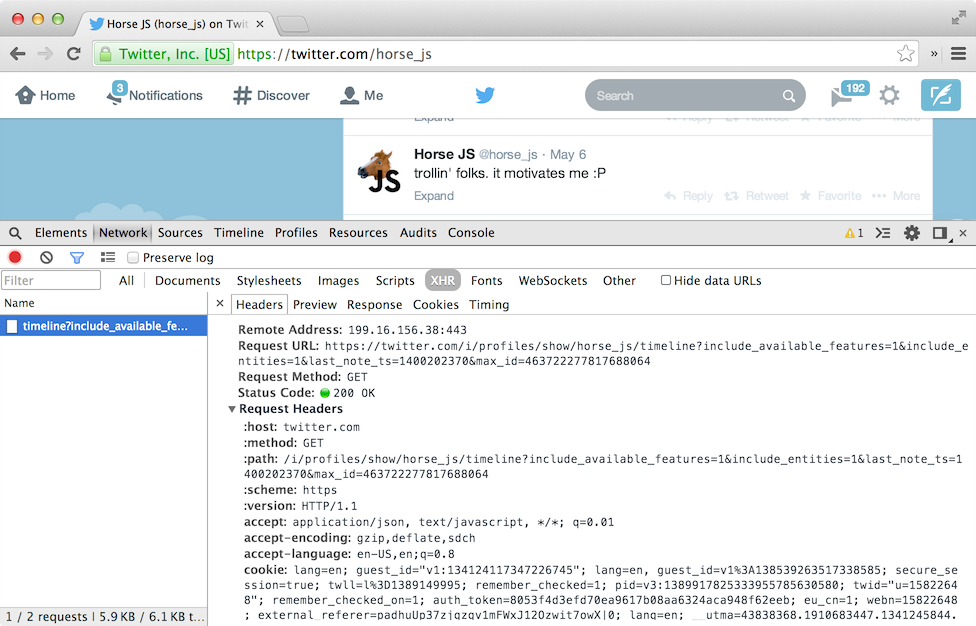
- A request with "timeline" in the name should appear.
The Headers tab provides you with information about the headers sent and received in the ajax request. There's a lot of interesting information here you can dig into. Take a look.
The Preview tab lets you preview information about the ajax response. That means the developer tools format it a bit for you.
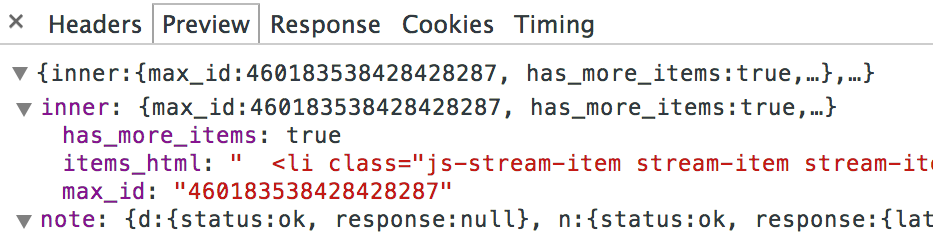
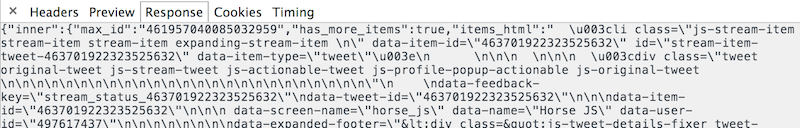
The Response tab lets you see the ajax response as text without the developer tools doing anything special to it.
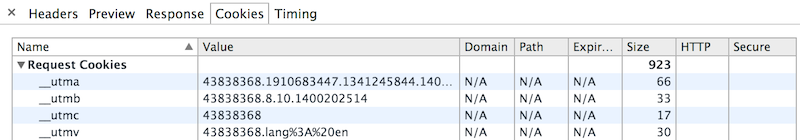
The Cookies tab shows you the cookies associated with the request.
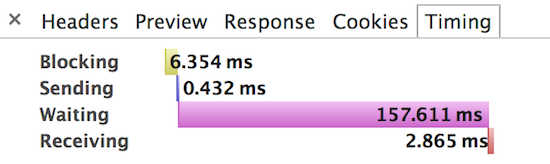
The timing tab provides you with information about how long the parts of the ajax request took.
Let's try it out!
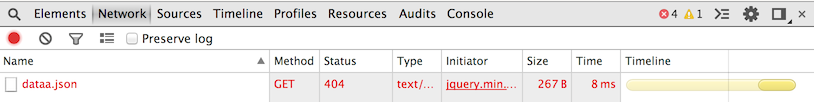
We have a simple script that is supposed to load some quotes from data.json via an ajax request and create a list of the quotes in the section below.
Dune Quotes

Let's try it out.
Hmm, something has gone wrong. Can you figure out what?
Performance
Debugging performance issues in JavaScript could be a whole post by itself. For now, I'll point you to some useful information if you want to dig into this topic sooner:
- jsPerf
- Evaluating network performance
- Performance profiling with the Timeline
- Profiling JavaScript Performance
- JavaScript Memory Profiling
Mobile
You can emulate some mobile interactions using the developer tools, so that you can do debugging on your desktop browser. Check out the mobile emulation documentation for more information.
You will also likely need to do some debugging with real (or simulated) mobile devices. Check out these posts for some more information.